| 1. Networks of Alumni: Visualizing Employment Trends of Early Farm School Alumni

- Author: Allie SCHOENAUER
 - Abstract: Newspapers have been a focus for digital preservation because of the fragility of the material and the amount of information they contain. Recently, the McDonogh School has undertaken a project to digitize its long-running student newspaper, The Week, and make it available online through Digital Maryland, a public history project run out of the Enoch Pratt Library. This newspaper regularly reported on recent developments in the lives and careers of alumni, some of whom had taken up positions in and around Maryland, and some of whom had moved out of state or out of the country.
This project aims to use software like ABBYY Fine Reader and OpenRefine to extract and manipulate information related to alumni published by The Week. Specifically, this project is looking at career and location information shared with The Week publishers in order to understand the reach McDonogh School alumni had in the early years of the school. This project also hopes to illuminate relationships that may be obscured by the unstructured nature of the information presented in The Week and visualize them using Tableau.
- Dataset: McDonogh School Registry, The Week Vol. 1, Weeks Baltimore Directory 1883
- Tools: ABBYFineReader, Neo4j, Tableau, and Jupyter Notebook
- Video: https://youtu.be/HqlVCC4iry4 (25′ 34″)
|
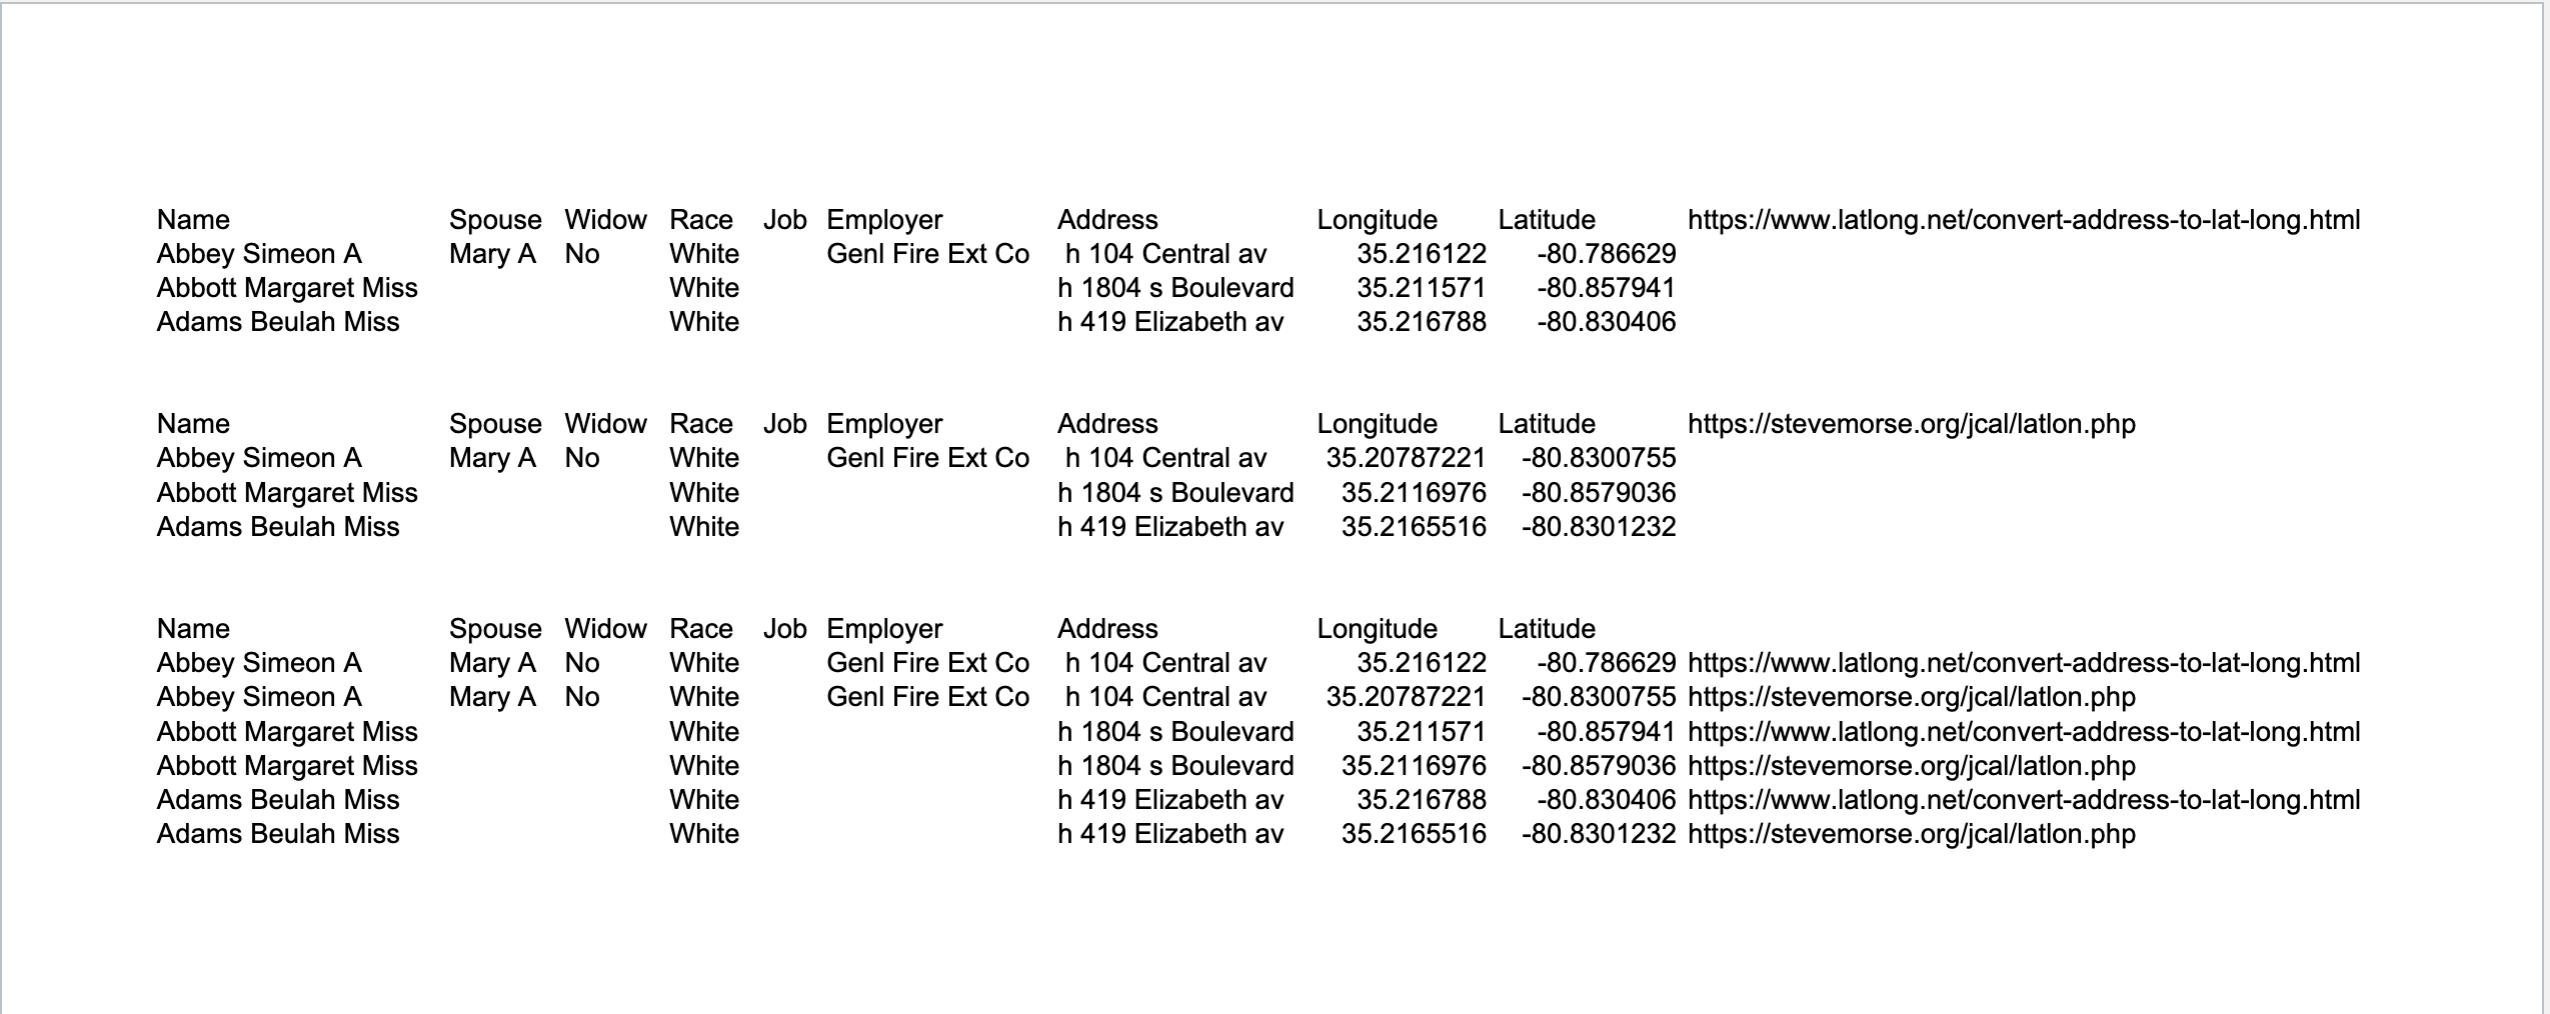
| 2. Snapshot of Tryon Street in 1911 Charlotte

- Author: Jeni CROCKETT-HOLME
 - Abstract: According to the preface of the 1911 Charlotte (NC) City Directory, Charlotte was undergoing a period of “marked growth and development,” demonstrated by a noticeably busy real estate market. That growth includes what we would now call “urban sprawl” and the flight of the wealthy to new suburbs. This project explores computational archival tools to analyze and visualize data from the 1911 city directory, with a focus on the properties along Charlotte’s busiest street: who lived there, what work they did, and the services they had. For someone moving to Charlotte in 1911, what does Tryon Street have to offer?
- Dataset: Full 1911 Charlotte City Directory (16,000 entries)
- Tools: GoogleMaps, MS PowerPoint, OpenRefine, MS Excel, MS Word, Tableau, Mapquest Developer Latitude/Longitude Finder, QGIS, and Jupyter Notebook
- Resources:
- (1) Charlotte Mecklenburg Library, “Farewell Views of Charlotte, 1900-1910,” https://www.cmstory.org/exhibits/turn-20th-century-life-charlotte-1900-1910-views-city/farewell-views-charlotte-1900-1910;
- (2) Thomas W. Hanchett, “The Center City: The Business District and the Original Four Wards,” HistorySouth.org, n.d., https://www.historysouth.org/wp-content/uploads/2020/07/THE-CENTER-CITY.pdf;
- (3) University of North Carolina at Chapel Hill, “Charlotte, NC Sanborn Maps,” https://unc.maps.arcgis.com/apps/webappviewer/index.html?id=457380ba8fc14b558909d8a200df7d9b.
- Video: https://youtu.be/QhttaPISJn0 (19′ 58″)
|
|
| 3. Expanding the Charlotte 1911 Directory Through Reparative Metadata Creation
 
- Author: Eleanor VANDER LAAN
 - Abstract: One of the notable features of the Charlotte 1911 Directory is that most married women are listed in the same line as their husbands. When datafying the directory using an entry-based approach, a married woman gets buried in the same entry as her husband. Having a husband and wife share the same entry not only takes away the wife’s importance as an adult in the household, but is also skews much of the demographic data we are able to extract from the Directory.
My project to create entries for the wives is inspired by the concept of reparative archival description. Many contemporary archives have been updating collection metadata to give personhood back to women who were only referred to by their husbands’ names. For example, “Mr. and Mrs. John Smith” would become “Mr. John Smith and Mrs. Jane Smith” or even “John Smith and Jane Smith.” This project applies the same concept to the dataset, hoping to expand out the entries to give wives their proper recognition.
- Research questions: (1) How does adding directory entries for the hidden women change the Charlotte 1911 Directory data? (2) How does adding hidden women change the demographic ratios for gender, race, and marriage rates?
- Datasets: Full 1911 Charlotte City Directory (16,000 entries), Social Security Administration Popular Baby Names Dataset
- Tools: Excel, OpenRefine, Python, Tableau, Neo4j, and Jupyter Notebook
- Video: https://youtu.be/qKcPWii76Xo (25′ 14″)
|
|
| 4. Tour De Caleb: Mapping and Visualizing a Cycling Training Season

-
- Author: Caleb HURLEY
 - Abstract: This project explores how personal fitness and movement data can be transformed through data curation, visualization, and geospatial analysis. Using 8 selected cycling training sessions from seven months of cycling training data stored in TCX (Training Center XML) files, the project analyzes patterns in cycling activity over time, including route evolution, distance traveled, average speed, elevation gain, and power output.
The project investigates how born-digital fitness data can be curated and interpreted as both quantitative and narrative evidence of behavioral patterns, physical progression, and geographic movement. Rather than focusing only on statistical summaries, the project emphasizes storytelling through visualizations and mapping. The project asks the following research question: How can personal cycling telemetry data be transformed into a computational narrative about training progression, spatial movement, and physical activity over time?
The project involves extracting and cleaning TCX ride data, converting GPS coordinate information into usable geographic datasets, and creating visualizations that illustrate trends in training volume and performance. GPS route data from rides will be visualized in QGIS to create maps tracing ride locations over time. Tableau dashboards and graphs will be used to visualize changes in ride distance, average speed, elevation, and power metrics across the 8 selected rides from the seven months.
The project narrative moves from geospatial data without power metrics, to power-based structured data without geospatial data, then training records with both data types combined. The notebook documents the workflow used to transform raw TCX telemetry data into curated datasets and visual representations. The project also aims to demonstrate how digital humanities and data curation methodologies can be applied to fitness datasets rather than traditional archival or historical records.
- Dataset: Personal cycling ride data and GPS coordinates data exported to TCX files from cycling applications (Strava and Cadence) and converted to CSV files.
- Tools:
- Python/Powershell/Notepad++/GPSBabel
For converting TCX files into CSV files suitable for mapping and visualization
- Excel
For combining data from multiple CSV files into a single CSV dataset for normalizing and creating visualizations.
- OpenRefine
For cleaning, organizing, and transforming extracted cycling ride datasets into structured CSV files suitable for mapping and visualization.
- QGIS
For geospatial visualization of cycling routes using GPS coordinate data extracted from TCX ride files.
- Tableau
For creating dashboards and visualizations showing trends in cycling metrics such as distance, speed, elevation gain, and power output over time.
- Jupyter Notebook
For documenting workflow, presenting narrative analysis, and organizing the final computational storytelling project.
|
|
| 5. Popular Professions in 1911 Charlotte

- Author: Emma LYONS
 - Abstract: Through using the 1911 Directory, I will clean up and sort data in OpenRefine to identify the most common jobs at the time. I will then analyze popular jobs based on race, marital status, or gender, if possible. Through this research, I will ask: Were the most popular professions segregated? Were particular industries segregated? Are any of these professions still prevalent today? Were these jobs specific to Charlotte? After I discern jobs of interest, I will represent the information visually to make it more digestible.
- Dataset: Full 1911 Charlotte City Directory (16,000 entries)
- Tools: Excel, OpenRefine, Tableau, Neo4j, and Jupyter Notebook
- Video: https://youtu.be/pCyIbmreESY (20′ 25″)
|
|
| 6. Creating Archival Datasets for Beginners: Using both Traditional Methods and AI

- Author: Amy Daniel
 - Abstract: Explores and contrasts the ways one can create a dataset from digitized documents using traditional methods (OCR) and AI.
- Dataset: Selected pages from the Charlotte 1911 Directory
- Tools: AbbyFineReader, OpenRefine, Google NotebookLM, Excel, and Jupyter Notebook
- Video: https://youtu.be/0zXk2lYbYTo (22′ 12″)
|
|
| 7. Analyzing Language Disparities: Exploring the 1926 Irish Census for the Boola District Electoral Division (DED)
  
- Authors: Connor BUCKLEY, Mati KASSAYE, Ben POLLOCK
   - Abstract: Just this year (2026), the 1926 Census of Ireland was made available to the public by the National Archives of Ireland. A searchable database leads users directly to scans of the Census documents filled out by each and every family in Ireland. These individual documents, and specifically those emerging from the town of Knocktoosh in the District Electoral Division (DED) of Boola in the county Limerick, contain what would ultimately become the dataset we used for this exploration.
Our decision to explore this data was prompted by the familial ties of one of our group members (Connor). The image below depicts family members of Connor’s as depicted in one of the twenty-eight Census forms (containing a total of 131 individuals) which we would incorporate into our dataset.
Objectives: This project aims to explore the key demographic markers of gender, occupation, and language proficiency (as represented in the Census forms) in Knocktoosh. By highlighting occupation, language, and gender, we intend to compare and contrast the residents of Knocktoosh as individuals while also creating an in-depth snapshot of the village as it was 100 years ago.
- Dataset: 1926 Census of Ireland entries for the 131 residents of Knocktoosh, Co. Limerick. This dataset is available through the National Archives of Ireland’s website.
- Tools: ABBYFineReader, Lido’s OCR, OpenRefine, Neo4j, QGIS, and Jupyter Notebook
- Video: https://vimeo.com/1194430623/38fd9fe3ce (20′ 49″)
|
| 8. Economic Dimensions of African American Neighborhoods 1911 Charlotte

- Author: Jada YOLICH
 - Abstract: This project aims to explore the fundamental questions related to Black neighborhoods’ economic viability. I chose to look at the rates of home ownership, employment rates and job types, and locations of business to see how many there were in African American neighborhoods, and then use that data to roughly gauge what economic opportunity existed in these locales. To accomplish this, I first used OpenRefine to clean up the dataset to best fit my purposes; Python to calculate latitudes and longitudes of residents’ addresses; QGIS to plot those geographic coordinates; Tableau to visualize the data and gain a clearer understanding of the narrative it tells, and Neo4j to answer some lingering questions.
- Dataset: Partial 1911 Charlotte City Directory (4,594 entries)
- Tools: OpenRefine, Neo4j QGIS, Tableau, Jupyter Notebook, and Python
- Video: https://youtu.be/-4VWuKsT8pY (19′ 43″)
|
| 9. Analyzing Migration and Population Movement Records: a Personal Exploration

- Author: Gregory SZWARCMAN
 - Abstract: Generate OCR for family records belonging to my great-grandparents, both of whom emigrated from Italy in the early 20th century. My great-grandfather, Luigi, immigrated to the U.S. in 1914, just months before WWI broke out. The oldest records I have are his Italian passport and military records, circa 1913. My goal is to extract metadata from the documents. Luigi died young in 1926, so it would be nice to be able to glean more info about his life from these documents.
- Dataset: Ellis Island Passenger Lists
- Tools: OpenRefine, Google NotebookLM, Jupyter Notebook
- Video: https://youtu.be/Dwzt-Jeujoc (16′ 32″)
|